Do lenient grading standards reduce learning?
This week I read a paper forthcoming in American Economic Journal: Economic Policy on grading leniency. And spoiler alert: Their answer is: Yes

When Denmark replaced the old 13-scale with the current 7-point grading scale, we went from awarding the top grade in roughly 1 out of 200 assessments to giving it in more than 20 out of 200. I dream about studying how this change affects students’ effort. After all, why put in the same amount of work it once took to be the best out of 200 when your achievement now only shows that you’re among the top 10 percent?
(Yes, I’m aware of intrinsic motivation.)
A reform: fewer points for the same grade
Someday I will find a way to test my hypothesis above. While waiting, I read a new paper by A. Brooks Bowden, Viviana Rodriguez and Zach Weingarten that does something related. The paper is accepted for publication in AEJ:EP. They study a reform where they adjusted grading standards in schools in North Carolina.
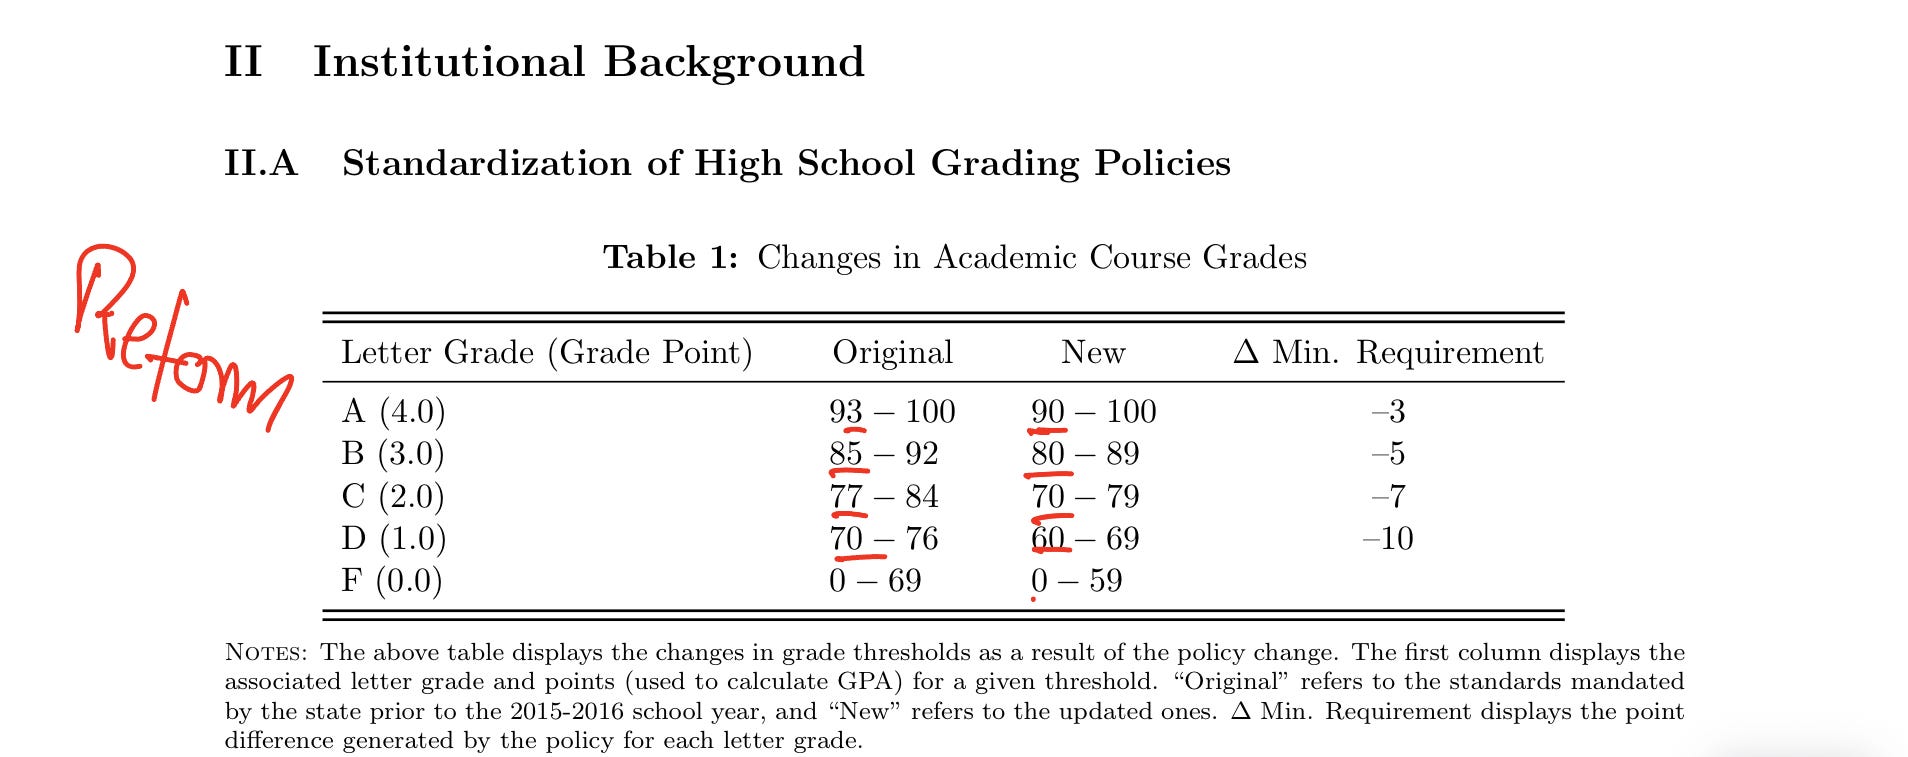
As the figure shows, until 2015 a score of 92 would give you the grade B, but after 2015 the same score gives you the grade A. Importantly, the change is bigger, the further down the distribution we go. So if you were a student investing all your effort to only just get the grade D with the score 70, you could now relax, play more soccer and still get the same grade scoring only 60.
A clear behavioral change
So what is the consequence of the reform? Now assume all students (and teachers!) behave just like before. We should now see a substantial increase in GPA. But just looking at the raw data, we observe that students (and/or) teachers do not behave in the same way.
The Figure below shows the distribution of points in Math. Before and after the reform. We clearly see a lot more mass in the distribution between 60 and 70 points. An area that would mean an F before, but which now means a D.
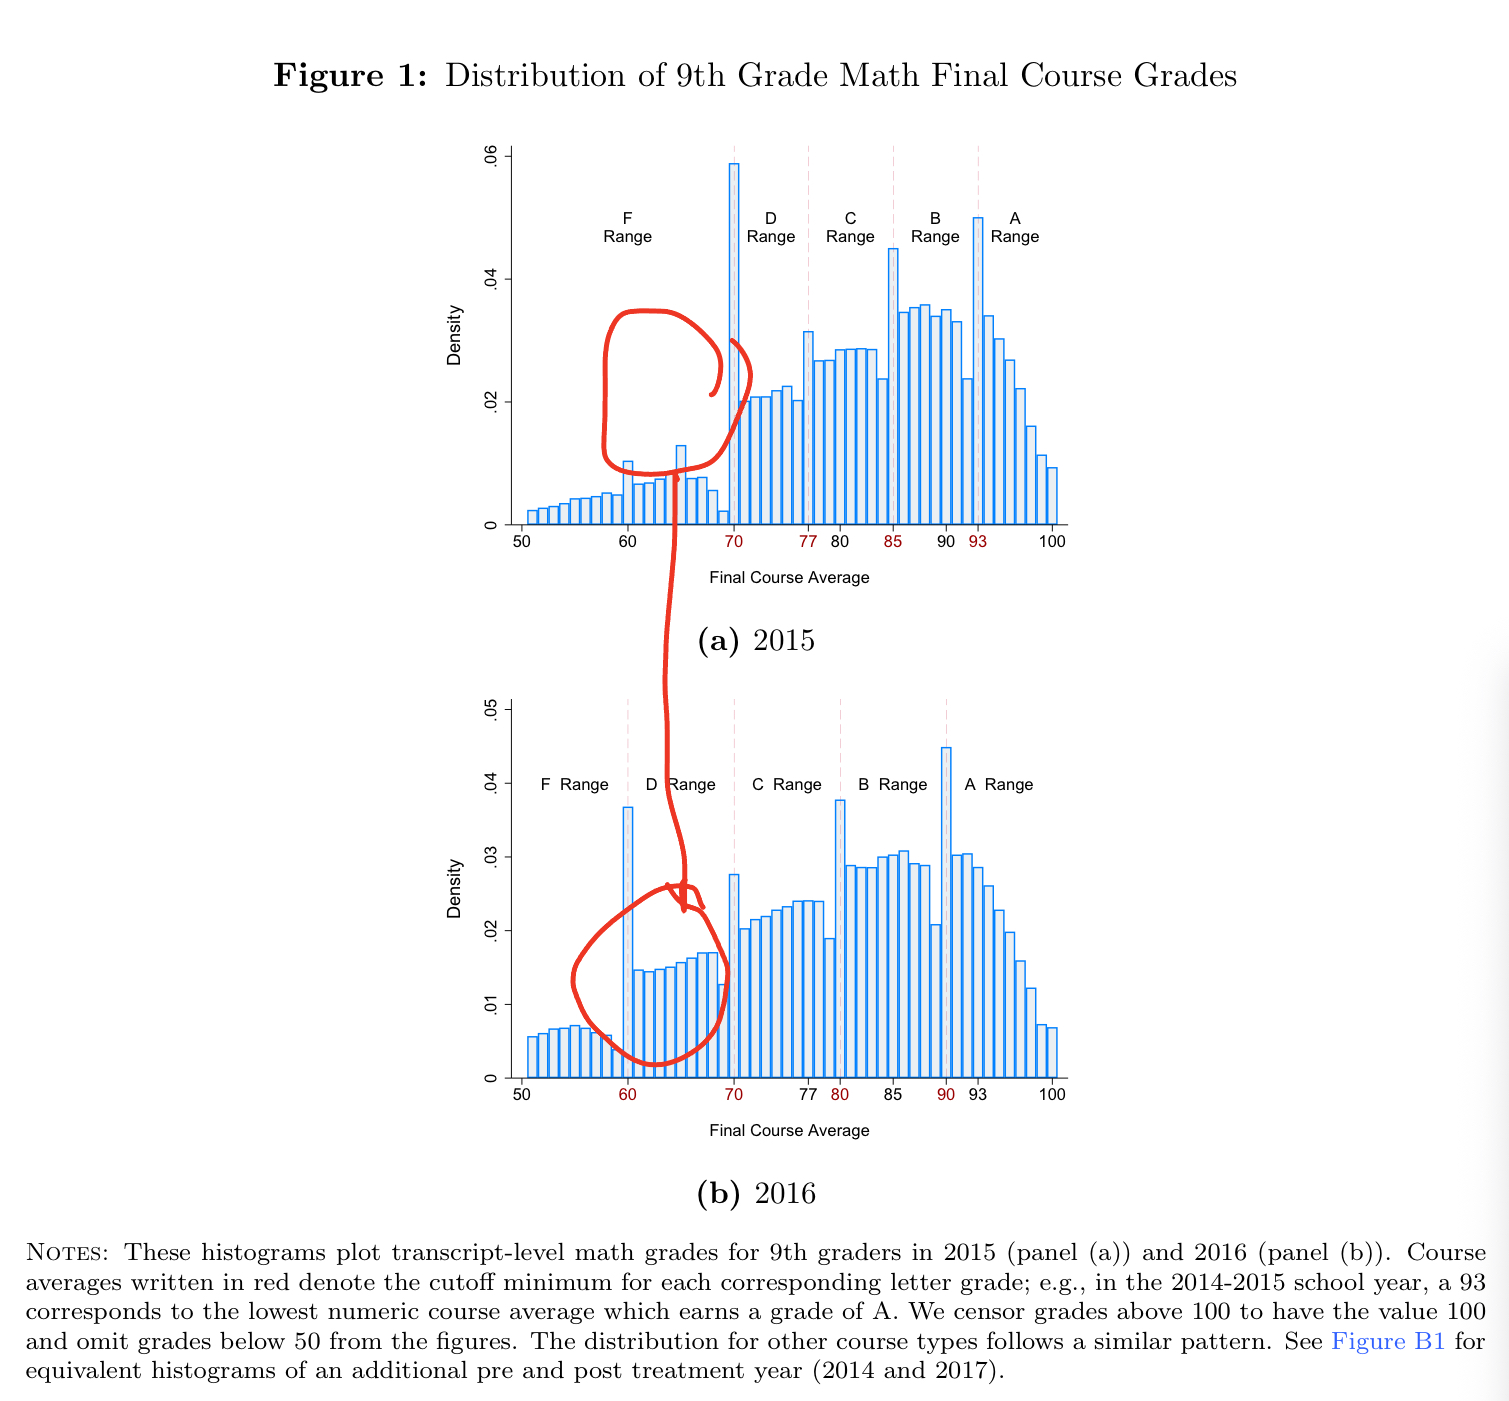
So why are fewer students now scoring 70 and way more are scoring 60 and above? One explanation is the one I gave above. Students relax more. But another explanation is a teacher response, which given the bunching at 60 and 70 (and 80 and 90) seems likely. So someone is changing behavior. Whether it is the students, the teachers or both is unclear.
RD-DiD results: more lenient grading → increase in absence
I will spare you the details of the estimation strategy. But the basic idea is to compare the first cohort with the new system to the last cohort without the system, by looking at individuals born just before and after the age entry cutoff. However, because of the usual school starting age effect, they are comparing that difference to the same difference in other years, without a reform.
Here is what they find in the short run:
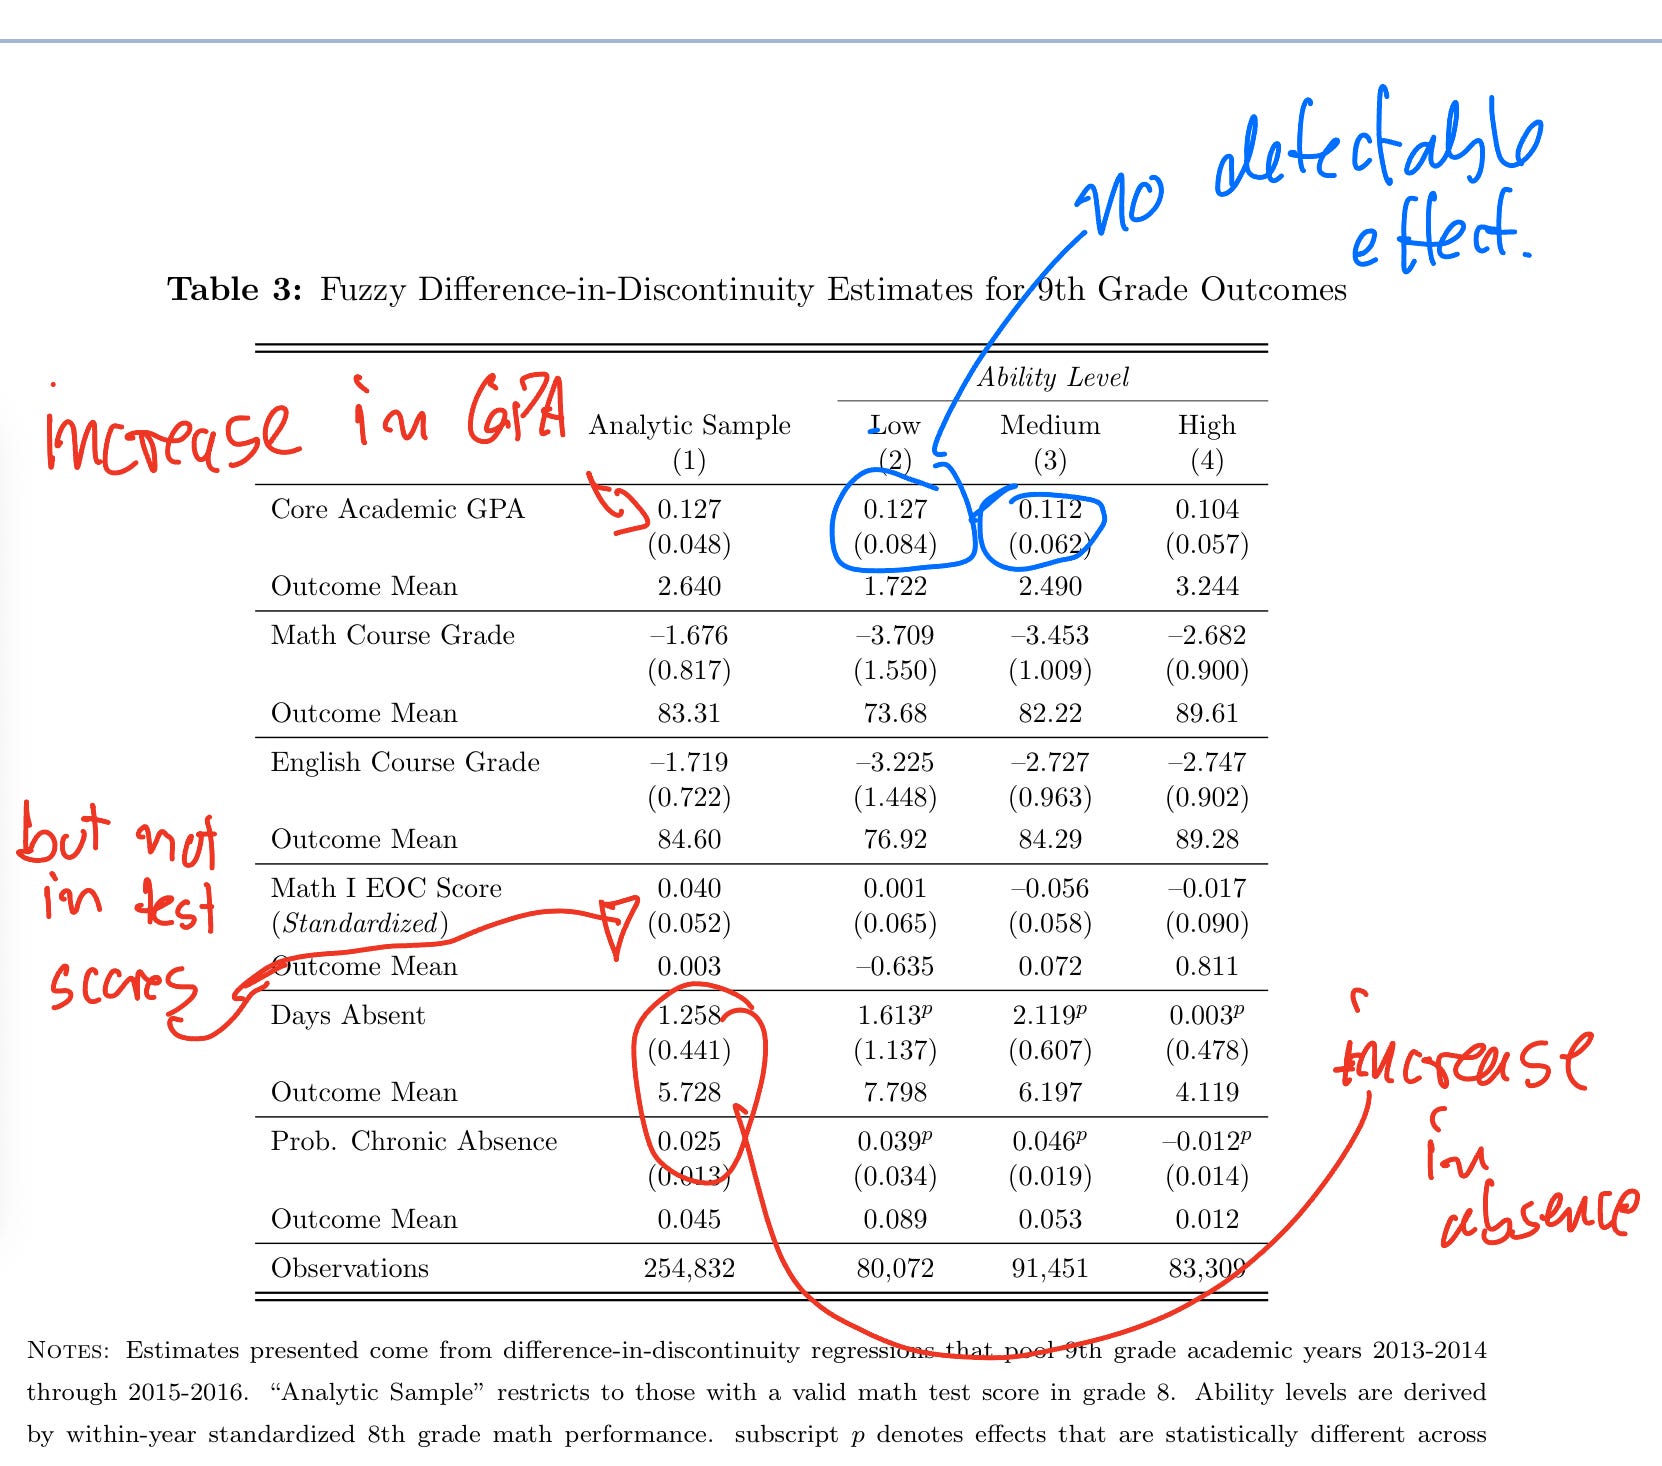
Increase in overall GPA. That is what we would expect mechanically. BUT the effect is not significant for the low ability (based on prior attainment) group. That is puzzling, because remember, they experienced the largest differences.
An increase in absence. An explanation for the lack of detectable effect for the low ability group is the increase in absence. So the cohort first exposed to the lenient grading scale has higher absence.
Importantly, the absence effects are driven by the low and medium ability groups. There is no detectable effect for the high group!
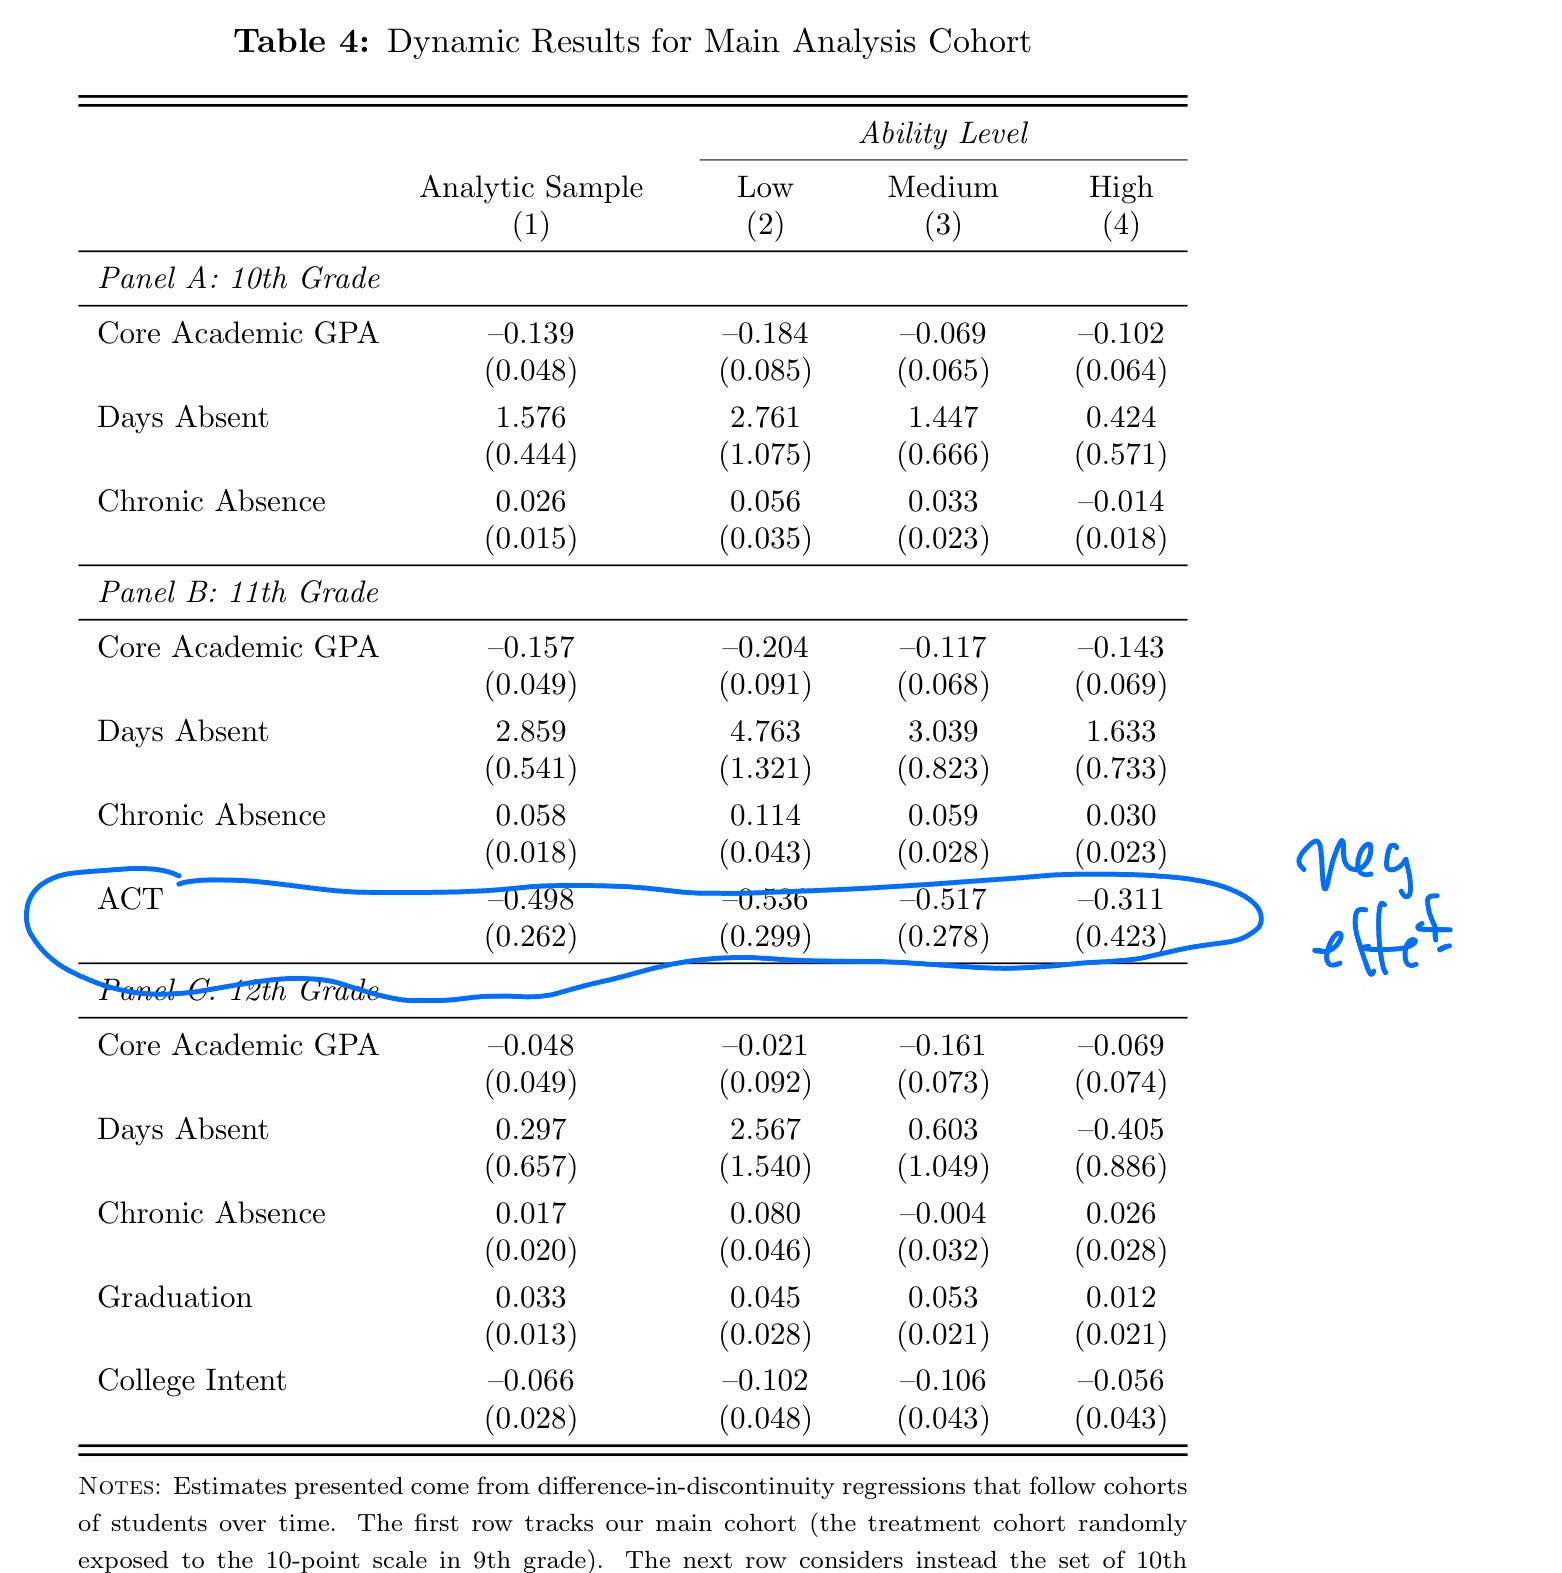
Longer run effects: worse ACT scores
To get a sense of actual learning effects, they look at later ACT scores. Unlike the GPA results, they are not contaminated by the direct effect of the reform. And indeed, they find signs of worse ACT scores later on. Especially for the low and medium ability groups.
Over and out
As always, there is a lot more in the paper. They provide the usual robustness battery of figures and tables required for RDD studies, placebo effects and they show evidence indicating that students are not exposed to worse teachers.
I will return to dreaming about my research hypothesis.